
International charters and agendas for heritage management
The European Landscape Convention (Council of Europe 2000) states that the landscape is: “… an area as perceived by people…”, but how strong is the voice of the people in landscape planning? How easily can the lived experience of local people be integrated into a framework of decision-making by local authorities?
The Faro Convention (Council of Europe 2005) and the Burra Charter (ICOMOS 2013) emphasise the importance of cultural heritage for society and encourage the participation of the public in the heritage decision-making process. However, practical solutions for the inclusive management of heritage and cultural landscapes have still to be developed.
Historic Landscape Characterisation and other approaches
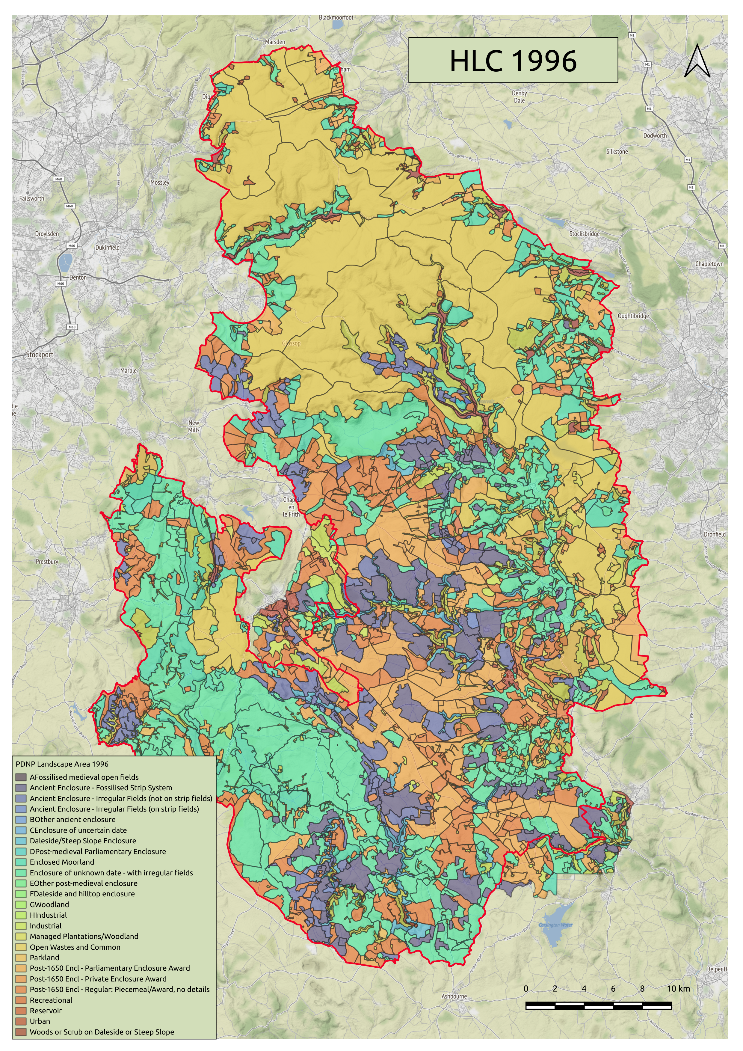
Landscapes are never passive, a point reflected in the creation of Historic Landscape Characterisation (HLC) (Fig. 1). HLC was created as a general, value-free tool for landscape management. However, it did not intend to create an abstract interpretation of a landscape excluding people but instead to include people’s perceptions in the characterisation process, adopt a common language, and create a tool for community engagement (Fairclough and Barnatt 1999; Turner 2018). Nevertheless, the historic environment often appears largely devoid of people, as reflected in the aerial image of the historic landscape in Figure 2.
Creative approaches to understanding people’s connection to place can involve various modes of artistic expression (e.g., visual arts or literary representations), which, due to the data format, are difficult to integrate into the planning and decision-making process (Crouch and Matless 1996; Nardi 2014). The challenge is to translate such qualitative data that seems “soft”, subjective and particular into a format that can be understood and articulated in a way that aligns with the planning process, i.e., that can be used in synergy with the “hard”, objective facts and quantitative data provided by landscape history and archaeology. An additional layer of local perceptions and lived experiences of the landscapes would provide local expertise that an outsider could not gain by assessing social values (Schofield 2014).
AI as an aid to analyse qualitative data for landscape management
While algorithms can analyse quantitative data in a resource- and time-efficient way, the solutions to qualitative data analysis are now being adapted for heritage management and planning. Artificial Intelligence (AI) can speed up the processes involved in qualitative data collection, analysis and visualisation. The “spatial turn” of the 1990s introduced GIS techniques to archaeology and heritage management but, more importantly, led to a new way of thinking of “landscape, perceived as spatial and temporal palimpsest of memories and meaning” (Heriland n.a.).
The “digital turn” at the beginning of the 21st century allowed the storage and analysis of “Big Data”. The revolution of AI has yet to arrive fully in the field of heritage management. Creative approaches have the potential to advance the methods and tools that will help make qualitative data analysis more efficient and effective. Automatic transcription of interviews, social media analysis, Natural Language Processing (NLP), and Machine Learning (ML) are just some methods that will help to understand and process qualitative data in a similar way as quantitative data.
Case study: Tweets in the Peak
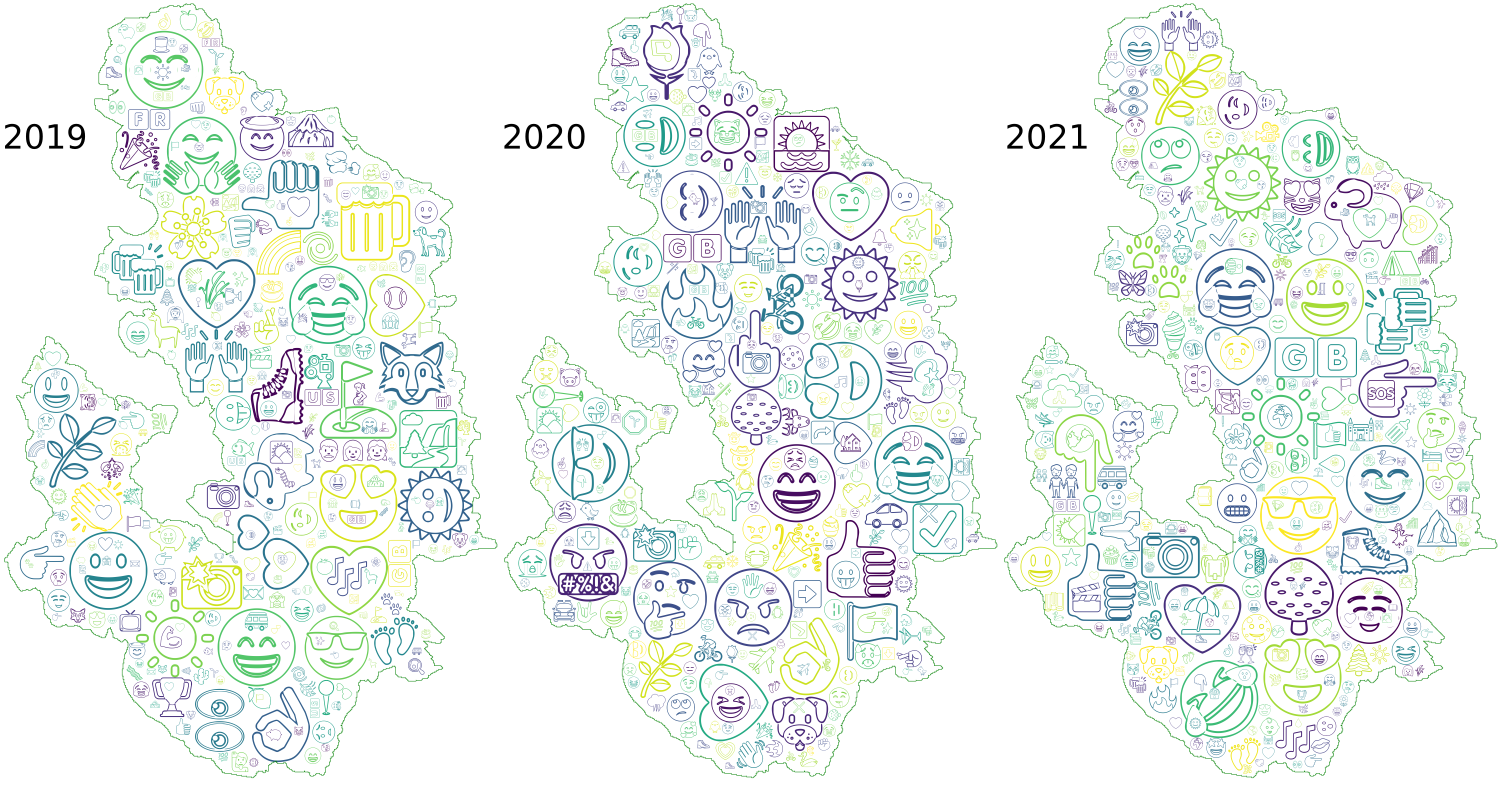
Creativity in data analysis and visualisation is one objective of my approach to bringing AI and people’s perceptions closer together. With my research, I want to present people’s perceptions in a form that can, on the one hand, interpret locally held meanings and values and, on the other hand, conduct automated analysis of these data using NLP and ML for the creation of time-efficient methods. The example of an emoji cloud (Fig. 3) shows the variation of people’s emotional connection to places in the Peak District National Park expressed in tweets before, during and after the Covid-19 pandemic (Tenzer 2022).
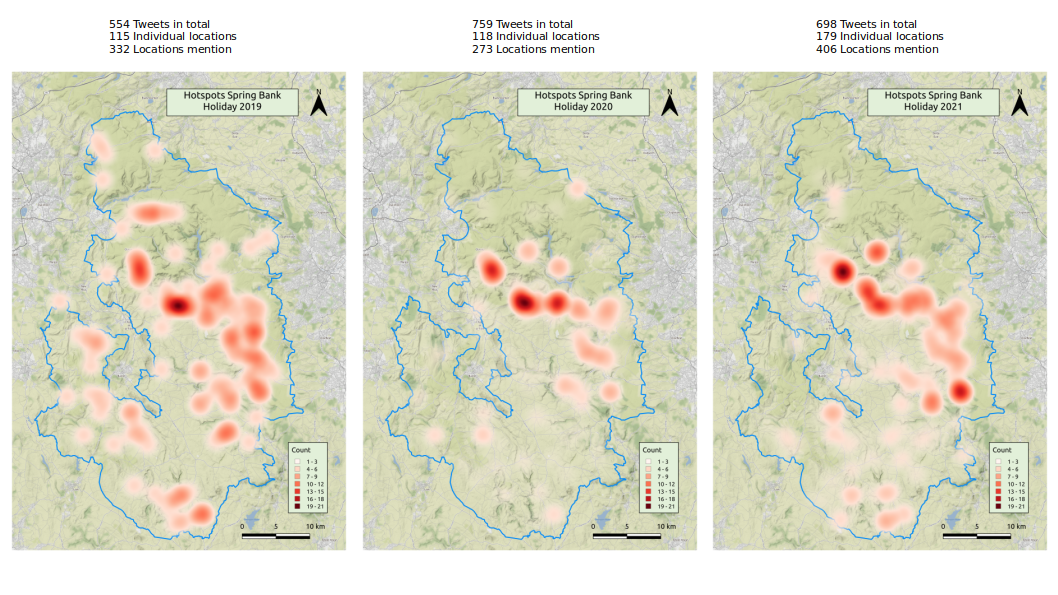
Furthermore, a method for fine-grained, area-specific location detection based on Named Entity Recognition can extract locations from tweets and automatically place them on a map. Figure 4 shows the places mentioned in connection to the emotions expressed in the emoji map. This approach to public perception interpretation is founded on two basic principles. Firstly, social media analysis offers a wealth of information, and AI offers a tool to analyse large amounts of data in a time-efficient way. Secondly, heritage conversation should start by finding a common language – visuals that do not need any explanation or description but instantly convey their content. This novel data analysis and visualisation approach can provide a vital basis for discussion and spark interest in the landscape as a social space.
Limitations of AI
AI is by no means a magic box that presents us with perfect results. Analysing language is an inherently different field for data scientists and linguists. For example, in my social media research, the algorithm did not pick up sarcasm, and this was particularly apparent in the Covid year of 2020. Even for humans, understanding sarcasm can be very difficult, especially in electronic communication. This was the reason for introducing emojis in the first place – to understand the undertone of a message without reading the sender’s facial expression ( word of the year 2015 in the Oxford Languages) or body language. Also, word ambiguities, especially with location recognition, proved challenging. AI struggles, for example, with the word “hope”. This word was used to express “hope that the pandemic is over soon”, but it can also represent the village Hope in the Peak District. Despite the limitations, AI has huge advantages and is a constantly evolving field. It can deal with large amounts of data, learn and improve through training, and yield sometimes surprising results.
People’s perceptions as a management tool
There is room for people’s perceptions in heritage management if researchers and practitioners are willing to embrace the new technologies and are given the resources to do so. In reality it shouldn’t take much, and applications will get easier as the technologies improve. The need to manage landscapes is a worldwide phenomenon, as is the urge to give people a voice in how their neighbourhoods and environments are managed. New tools and approaches, which can be used in landscapes crossing borders and countrywide, will enable automated processes to help create practical, applicable solutions for inclusive and transparent heritage and landscape management that facilitate sustainable change and acknowledge and appreciate that landscapes are living, dynamic, socially constructed and natural spaces “as perceived by people”.